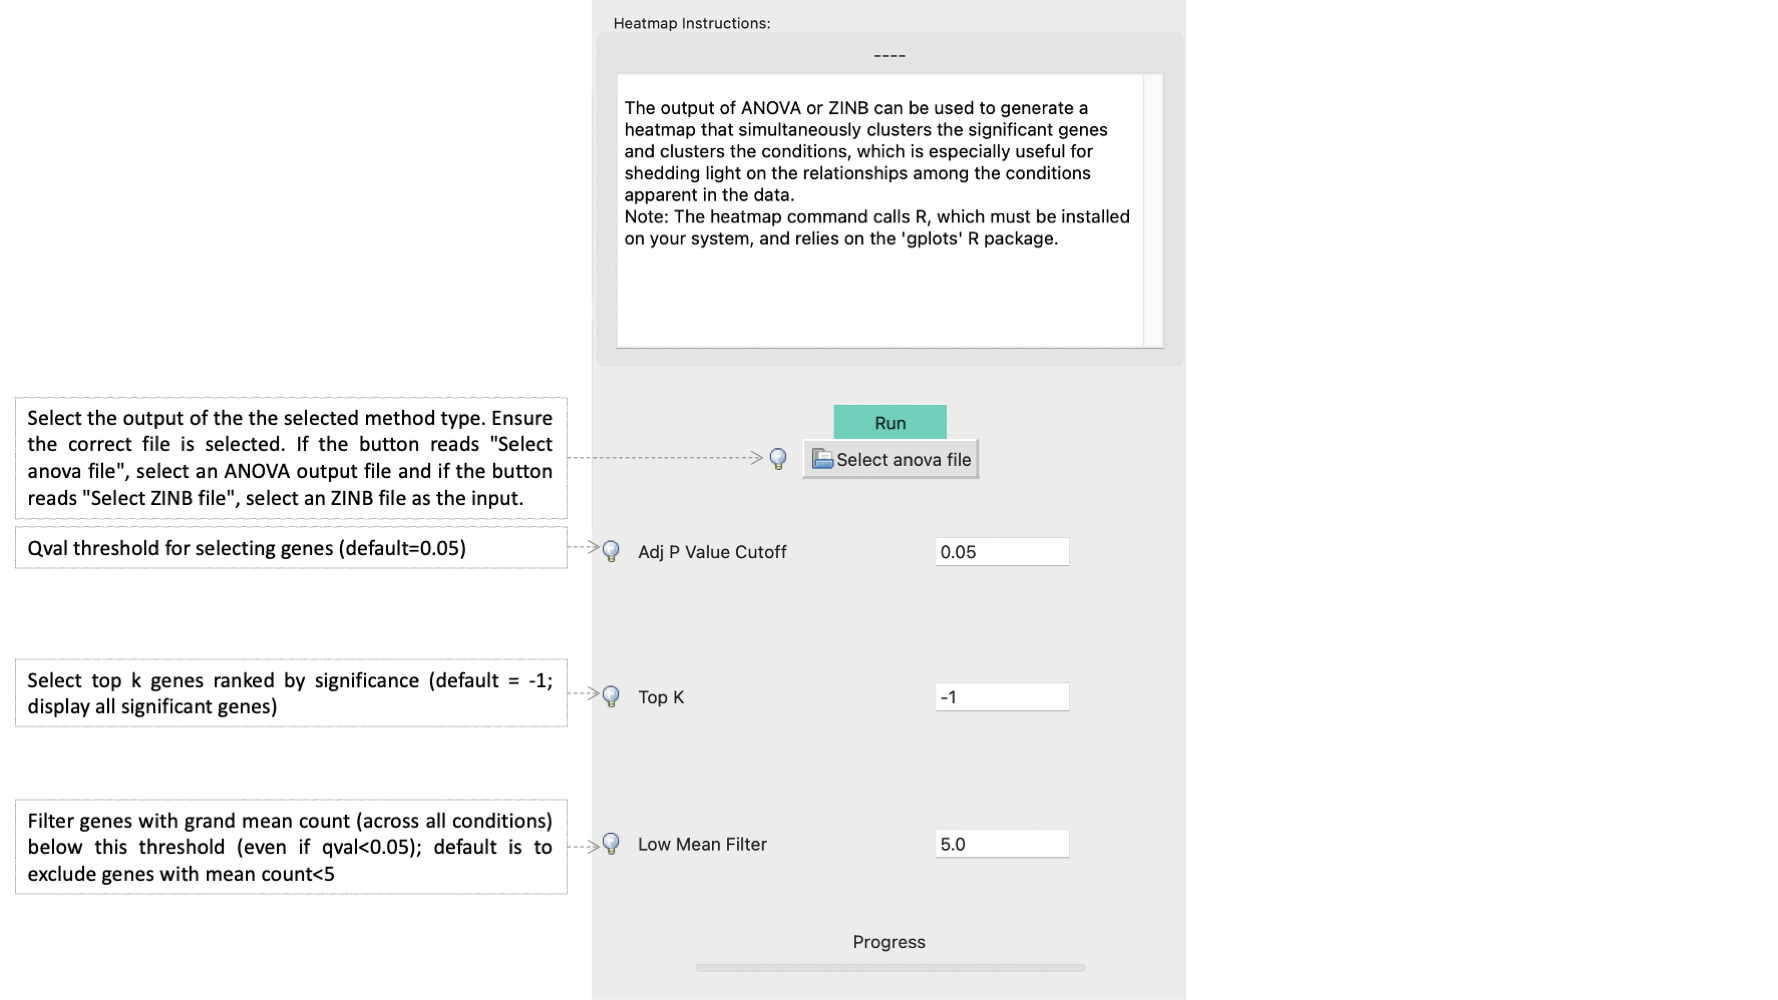
Heatmap
The output of ANOVA or ZINB can be used to generate a heatmap that simultaneously clusters the significant genes and clusters the conditions, which is especially useful for shedding light on the relationships among the conditions apparent in the data.
Command Line Usage:
>python3 src/transit.py heatmap <anova_or_zinb_output> <heatmap.png> -anova|-zinb [Optional Arguments]
 Optional parameters:
  --topk <int>            := number of results
  --qval <float>          := adjusted p value threshold. Default --qval 0.05
  --low-mean-filter <int> := Filter out genes with grand mean count (across all conditions) below this threshold(even if adjusted p-value < 0.05). Default --low-mean-filter 5
Note that the third argument is required to be either ‘-anova’ or ‘-zinb’, which is a flag to indicate the type of file being provided as the second argument.
By default, genes are selected for the heatmap based on qval<0.05. However, the user may change the selection of genes through 2 flags:
--qval <float>: change qval threshold for selecting genes (default=0.05)
--topk <int>: select top k genes ranked by significance (qval)
--low_mean_filter <int>: filter out genes with grand mean count (across all conditions) below this threshold (even if qval<0.05); default is to exclude genes with mean count<5
Here is an example which generates a heatmap of the results of ANOVA, where no reference condition was selected in the iron dataset
> python3 src/transit.py heatmap iron_anova_out.txt heatmap_iron_anova.png -anova
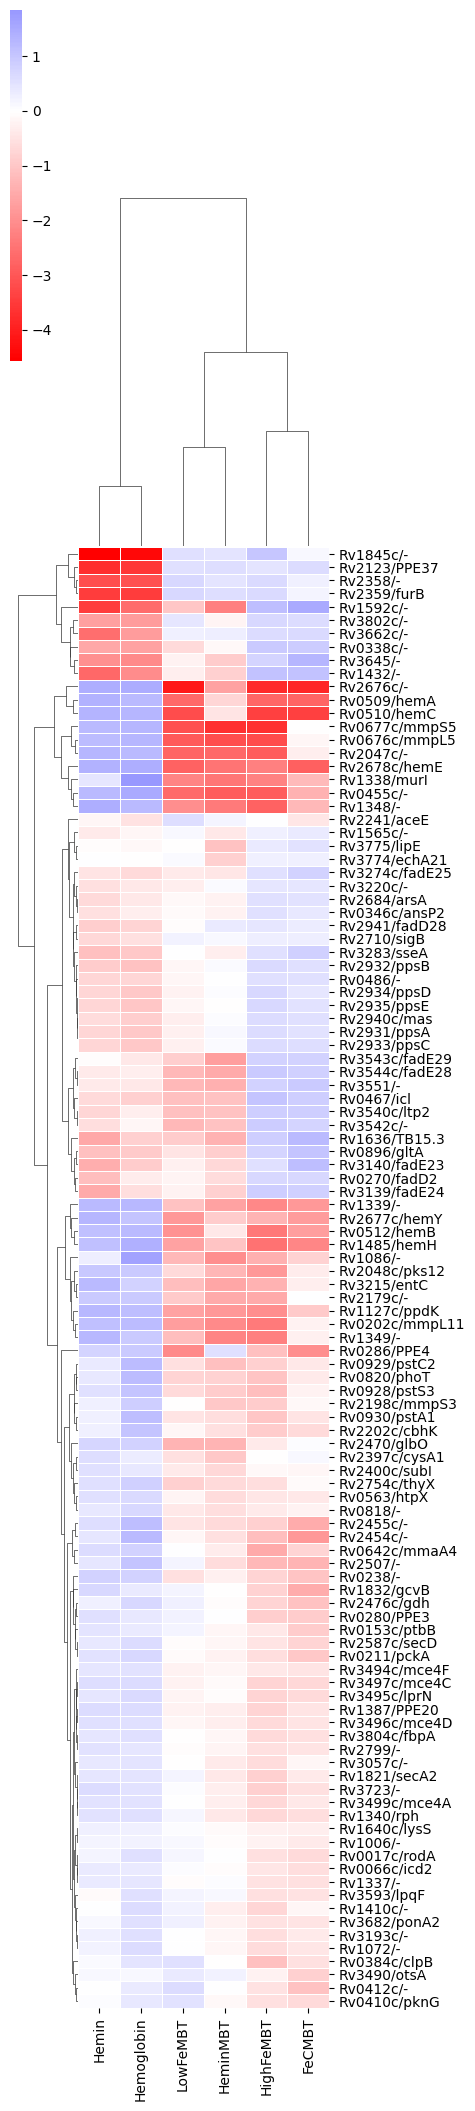
Importantly, the heatmap is based only on the subset of genes identified as significantly varying (Padj < 0.05, typically only a few hundred genes) in order to enhance the patterns, since otherwise they would be washed out by the rest of the genes in the genome, the majority of which usually do not exhibit significant variation in counts.
GUI:
Heatmap can be accessed through the actions dropdown (‘1.’ in the figure) of an ANOVA or ZINB file in the results panel or the “Post-Processing” tab in the Menu Bar (‘2.’ in the figure below).
When Display Heatmap is selected from the results action dropdown on a file, the heatmap function is run with default parameters. A file dialog box appears to save the heatmap. The heatmap is added to the results area and shows up as pop-ups.

When Heatmap is selected from the File Menu, the parameter panel is equivalent to the command line usage: