ANOVA
The Anova (Analysis of variance) method is used to determine which genes exhibit statistically significant variability of insertion counts across multiple conditions. Unlike other methods which take a comma-separated list of wig files as input, the method takes a combined_wig file (which combined multiple datasets in one file) and a samples_metadata file (which describes which samples/replicates belong to which experimental conditions).
How does it work?
The method performs the One-way anova test for each gene across conditions. It takes into account variability of normalized transposon insertion counts among TA sites and among replicates, to determine if the differences among the mean counts for each condition are significant.
Example
> python3 transit.py anova <combined_wig_file> <metadata_file> <annotation_file> <output_file> [Optional Arguments]
      Optional Arguments:
       --n <string>                     := Normalization method. Default: --n TTR
       --exclude-conditions <cond1,...> := Comma separated list of conditions to ignore for the analysis. Default: None
       --include-conditions <cond1,...> := Comma separated list of conditions to include for the analysis. Default: All
       --ref <cond>                     := which condition(s) to use as a reference for calculating LFCs (comma-separated if multiple conditions) (by default, LFCs for each condition are computed relative to the grandmean across all condintions)
       --iN <float>                     := Ignore TAs occurring within given percentage (as integer) of the N terminus. Default: --iN 0
       --iC <float>                     := Ignore TAs occurring within given percentage (as integer) of the C terminus. Default: --iC 0
       --PC <N>                         := Pseudocounts to use in calculating LFCs. Default: --PC 5
       --alpha <N>                      := value added to MSE in F-test for moderated anova (makes genes with low counts less significant). Default: --alpha 1000
       -winz                            := winsorize insertion counts for each gene in each condition
                                           (replace max count in each gene with 2nd highest; helps mitigate effect of outliers)
Input files
For description of input file formats, see documentation on Combined wig files and Metadata files.
Parameters
The following parameters are available for the ANOVA method:
--include-conditions: Includes the given set of conditions from the ZINB test. Conditions not in this list are ignored. Note: this is useful for specifying the order in which the columns are listed in the output file.
--exclude-conditions: Can use this to drop conditions not of interest.
--ref: Specify which condition to use as a reference for computing LFCs. By default, LFCs for each gene in each condition are calculated with respect to the grand mean count across all conditions (so conditions with higher counts will be balanced with conditions with lower counts). However, if there is a defined reference condition in the data, it may be specified using --ref (in which case LFCs for that condition will be around 0, and will be positive or negative for the other conditions, depending on whether counts are higher or lower than the reference condition. If there is more than one condition to use as reference (i.e. pooled), they may be given as a comma-separated list.
–n: Normalization Method. Determines which normalization method to use when comparing datasets. Proper normalization is important as it ensures that other sources of variability are not mistakenly treated as real differences. See the Normalization section for a description of normalization method available in TRANSIT. Default: -n TTR
–PC <N>: Pseudocounts to use in calculating LFCs (see below). Default: -PC 5
–alpha <N>: Value added to MSE in F-test for moderated ANOVA: F = MSR/(MSE+alpha). This is helpful because genes with very low counts are occasionally ranked as significant by traditional ANOVA, even though the apparent variability is probably due to noise. Setting alpha to a number like 1000 helps filter out these irrelevant genes by reducing their significance. If you want to emulate the standard ANOVA test, you can set alpha to 0. Default: -alpha 1000
-winz: winsorize insertion counts for each gene in each condition. Replace max count in each gene with 2nd highest. This can help mitigate effect of outliers.
Output and Diagnostics
The output file generated by ANOVA identifies which genes exhibit statistically significant variability in insertion counts across conditions.
The ANOVA method outputs a tab-delimited file with results for each gene in the genome. P-values are adjusted for multiple comparisons using the Benjamini-Hochberg procedure (called “q-values” or “p-adj.”). A typical threshold for conditional essentiality on is q-value < 0.05.
Column Header |
Column Definition |
|---|---|
Orf |
Gene ID. |
Name |
Name of the gene. |
TAs |
Number of TA sites in Gene |
Means… |
Mean readcounts for each condition |
Log 2 FCs… |
Log-fold-changes of counts in each condition vs mean across all conditions |
MSR |
Mean-squared residual |
MSE With Alpha |
Mean-squared error, plus moderation value |
Fstat |
Ratio of variance between groups vs. within groups (MSR/(MSE+alpha)) |
P Value |
P-value calculated by the Anova test. |
Adj P Value |
Adjusted p-value controlling for the FDR (Benjamini-Hochberg) |
Status |
Debug information (If any) |
LFCs (log-fold-changes): For each condition, the LFC is calculated as the log-base-2 of the ratio of mean insertion count in that condition relative to the mean of means across all the conditions. You can use the ‘--ref’ flag to designate a specific condition as a reference for computing LFCs. Pseudocount are incorporated to reduce the impact of noise on LFCs, based on the formula below. The pseudocounts can be adjusted using the ‘--PC’ flag. Changing the pseudocounts (via --PC) can reduce the artifactual appearance of genes with high-magnitude LFCs but that have small overall counts (which are susceptible to noise). Changing the pseudocounts will not affect the analysis of statistical significance and hence number of varying genes, however.
LFC = log2((mean_insertions_in_condition + PC)/(mean_of_means_across_all_conditions + PC))
GUI Mode
The Anova analysis method can be selected from the “Method” tab in the Menu Bar.
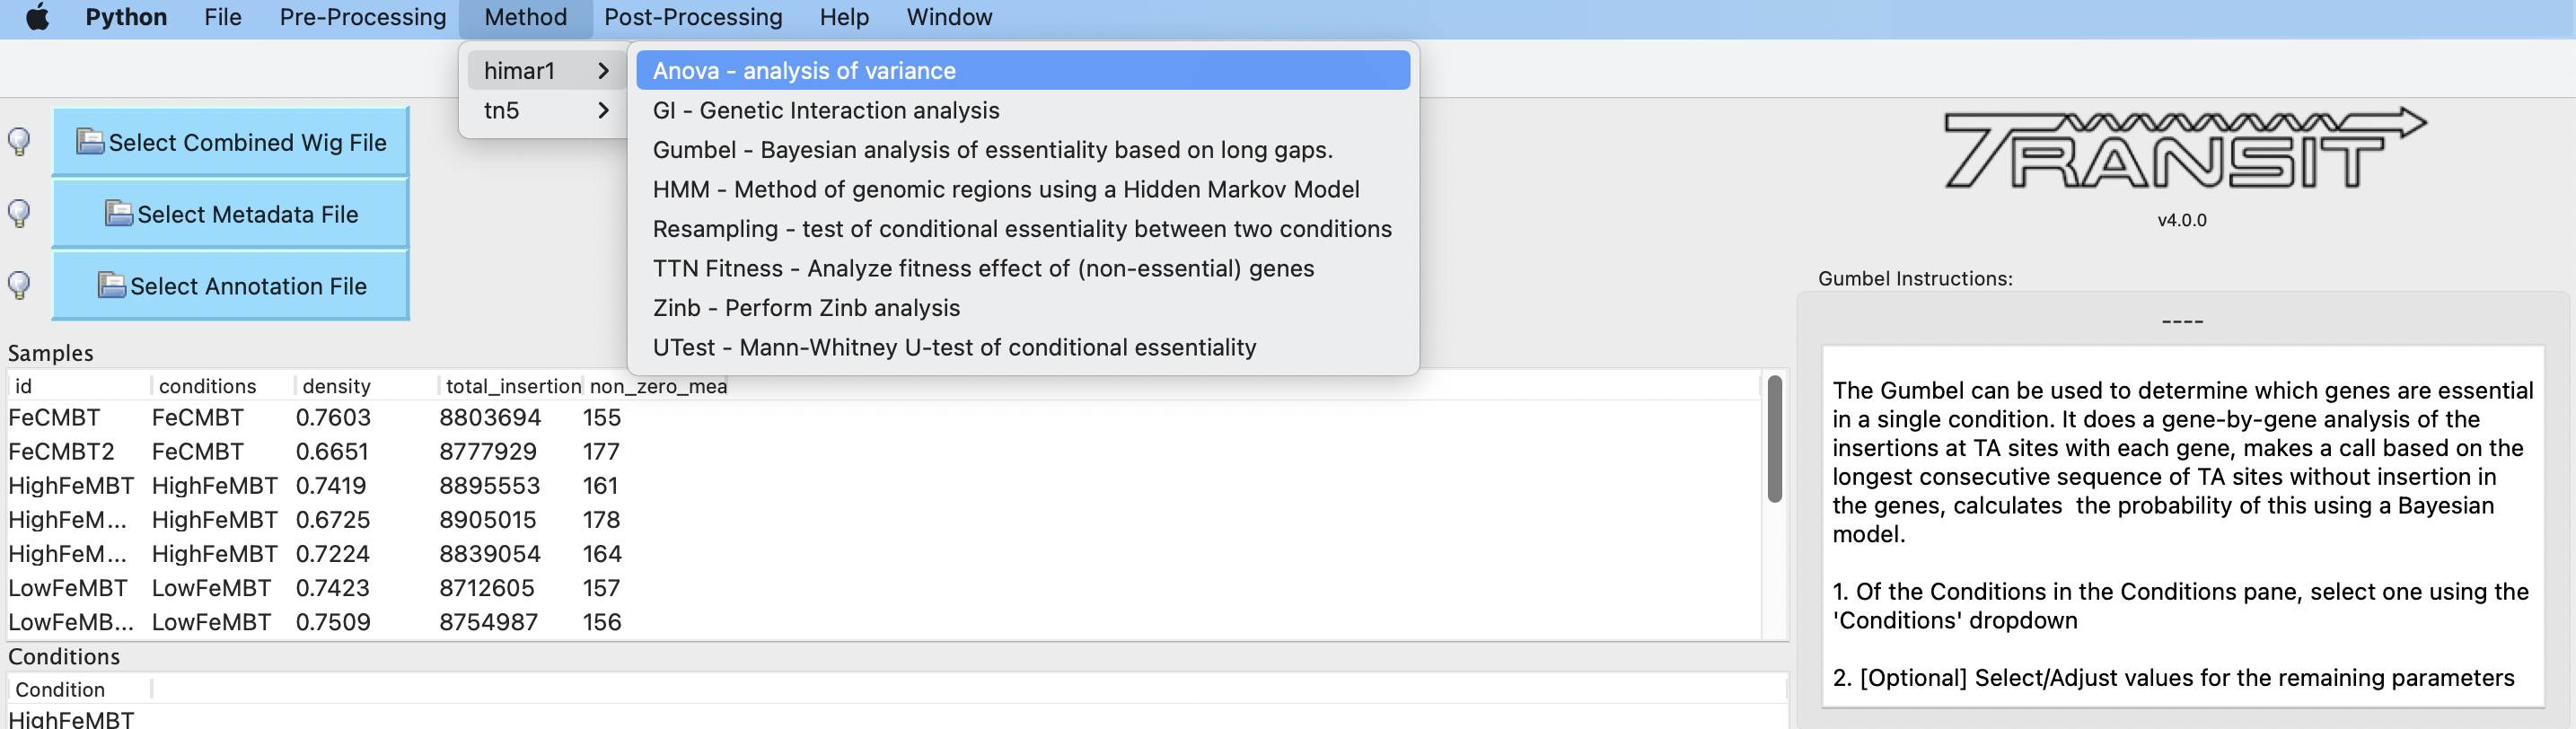
The parameters to input through the parameter panel for the method is equivalent to the command line usage (see parameter descriptions above for full detail):

Run-time
A typical run of the anova method takes less than 1 minute for a combined wig file with 6 conditions, 3 replicates per condition.